How we cut weld-defect rates from 3.1% to 0.4% in eleven months
The starting point: three causes behind a 3.1% reject rate
When the program started, the factory was running twelve TIG welding lines across two shifts, producing stainless steel and aluminum frames for outdoor furniture. Reject rate was measured at final visual inspection before packing, with any weld requiring rework counted as a defect. The plant average was 3.1%, but line-level performance ranged from 1.8% to 4.6%, which was the first sign that the problem was not a single process setting.
A Pareto analysis of 1,842 reject records over the previous quarter split the losses into four groups. Shielding gas contamination accounted for 34% of rejects, arc instability for 28%, fixture and fit-up drift for 22%, and the remaining 16% covered consumables, base-metal contamination and operator technique. Three causes accounted for roughly 84% of the problem, so the improvement plan focused there rather than on a plant-wide training campaign.
The earlier approach had been to treat every reject as an operator error and retrain. That produced short-term improvement on individual lines and no sustained change. The data showed that the same defect codes appeared across experienced and new welders alike, on the same shifts and the same part numbers, which pointed to process capability rather than individual skill.
Cause one: shielding gas purity and dew-point monitoring
The plant moved from general-purpose argon to a specified 99.998% purity grade, with oxygen below 2 ppm and moisture below 3 ppm, equivalent to a dew point of roughly -60 C or lower. The specification was written into the purchase order and every incoming lot was checked against a certificate of analysis. Gas purity is one of the few inputs that can be verified at the dock, and it is usually cheaper to audit than to chase porosity downstream.
The more important change was inline dew-point monitoring. A sensor was installed on the manifold feeding each group of cells, with a data logger recording readings every fifteen minutes. In the third month, the monitor caught a contaminated batch whose dew point rose from -62 C to -38 C over two days. That batch produced visible oxidation on aluminum and porosity on stainless steel before the cylinders were changed. Without continuous monitoring, the problem would have been attributed to fit-up or filler wire.
Gas-related defects fell from roughly 1.05 percentage points of the 3.1% baseline to about 0.15 points. The gas cost increased by 4% to 6% per cylinder, but the reduction in rework, re-inspection and scrap more than covered it. The same monitoring hardware was later extended to the laser and plasma cells, where shielding gas quality had not previously been measured at all.
Cause two: arc stability and penetration consistency
The second workstream retrofitted arc-stabilization controllers on the TIG power sources. The controllers regulated current to within about 1 A of setpoint, provided a repeatable high-frequency start, and held a stable arc at low amperage on thin sheet. Before the retrofit, penetration on 3 mm aluminum varied by roughly 18% between coupons cut from the same setup; after the retrofit, the variation fell to about 7%. Bead-width variation, measured as a coefficient of variation across ten coupons per shift, dropped from 12% to 5%.
Penetration was verified by macro-etch sections rather than by appearance alone. A shiny bead can sit on top of incomplete fusion, which is exactly the defect that passes visual inspection and fails in service. The plant now cuts and etches one coupon per line per shift during production and three coupons after any changeover to a new part or thickness.
Arc control did not fix everything. When fit-up gaps exceeded roughly 10% of sheet thickness, or when the base metal was contaminated with cutting fluid, the improved controller merely produced a more consistent version of a bad weld. Those conditions were addressed by the fixture and cleaning workstreams. The retrospective conclusion is that arc stabilization is a multiplier, not a substitute for joint preparation.
Cause three: fixture repeatability and positional drift
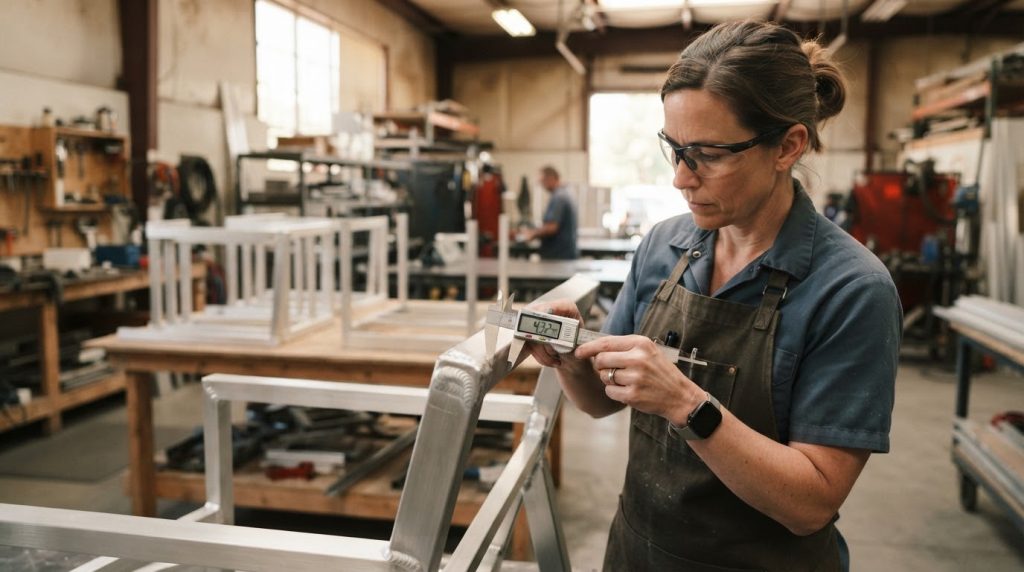
The third workstream replaced manual toggle clamps with servo-controlled fixtures and added laser guidance for part location. Positional drift was measured with a portable coordinate measuring arm at the start of the shift, at mid-shift and at the end of an eight-hour run. Before the change, the reference point drifted by as much as 0.35 mm over a full shift, largely from thermal expansion of the fixture as it absorbed heat from consecutive welds. After adding thermal compensation and a scheduled re-datum at mid-shift, drift fell to about 0.08 mm.
Clamping force was also standardized. Soft aluminum extrusions were being deformed by over-tightened manual clamps, which changed the joint gap and pulled parts out of square. Servo clamps with a controlled closing force removed that variable. Every fixture now has a daily check sheet covering clamp force, datum condition, locating-pin wear and the condition of the copper backing bars.
Fit-up and fixture-related defects fell from about 0.68 percentage points to 0.12 points. The fixtures cost more than the arc controllers, and they required a maintenance schedule that the plant did not previously have. That maintenance discipline, rather than the hardware itself, turned out to be the durable part of the change.
The measurement system: AWS D1.2, penetrant and radiographic sampling
Acceptance criteria were aligned with AWS D1.2 for aluminum structural welding. Visual inspection follows the D1.2 visual acceptance limits and is applied to 100% of production welds. Dye-penetrant testing follows ASTM E165 and is applied to first-off parts, to every changeover, and to a 5% sample of production welds on non-critical joints. Radiographic testing follows the relevant ASTM practice and is applied to 2% of butt welds and to 100% of welds on designated safety-critical assemblies.
The sampling frequency matters less than the feedback loop. Every PT or RT failure triggers a containment action on the parts produced since the last acceptable check, plus a root-cause record. The plant uses a short defect code list: gas porosity, incomplete fusion, lack of penetration, burn-through, undercut and arc strike. Each code is linked to a probable cause and an owner, and the weekly review looks at trends rather than individual events.
The system also includes a monthly capability review. For each line, the team plots reject rate by week, by shift and by part family. A line that runs above 0.8% for two consecutive weeks goes into a focused review, even if the plant average is acceptable. This prevents the average from hiding a deteriorating cell.
Results after eleven months, and three things that did not work
Eleven months after the first gas audit, the plant average was 0.4%, with a range of 0.2% to 0.7% across the twelve lines. The largest drop occurred in the first ninety days, mostly from gas specification and fixture maintenance. The arc retrofit produced a slower, steadier improvement over months four through eight. Rework hours fell by roughly 70%, and the cost of scrap and rework was reduced by an amount that paid back the fixture investment within the first year.
Three items did not work as expected. First, an AI vision system was trialed for internal porosity and could not see below the surface; it was retained for surface defects such as undercut and arc strike, where it performs well. Second, an attempt to reduce shielding gas flow rates to save cost increased turbulence and porosity, and the savings were reversed. Third, a blanket retraining program delivered without updating the welding procedure specifications had almost no measurable effect, because the process was already capable and the operators were not the limiting factor.
The transferable lesson is that weld quality is a system property. Gas specification, arc control, fixture repeatability and inspection sampling have to move together. A single intervention can produce a temporary improvement, but the reject rate returns when the other variables drift. The 0.4% result should also be read in context: it reflects this plant’s joint mix, thickness range and inspection standard, and is not a universal benchmark for every fabrication shop.